Police Data Analysis - Moving from Statistics to Insights

Police Data Analysis - Moving from Statistics to Insights

Author

PUBLISHED ON

As Mark Twain wrote, "Facts are stubborn things, but statistics are pliable."

Src: An Honor and Privilege to Serve

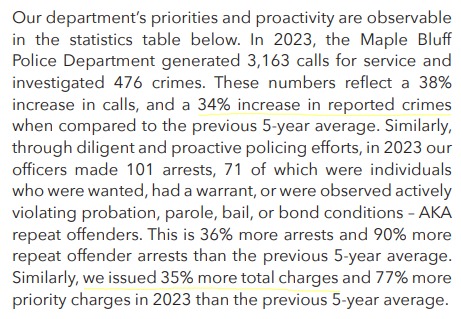
The statistics shared by the Chief of Police in a March 2024 community article made for grim reading. In 2023, calls for service were up 38%, a 34% increase in reported crimes, and 35% more charges were issued. It painted a dark picture of the state of the community compared to years past.  

The statistics presented had one problem: They were so different from what community members experienced that a deeper dive was needed.

Over the next five articles, we will share how we approached this analysis and enabled this community to ask better questions, provide better insight, and dig a little deeper to share an accurate picture about policing and safety in the community.  

Step 1: Understanding the data

  • What first-pass deductions can we gather?  
  • What data do we have, what can we get, and how will we correlate?  
  • Are we using a common language to describe the data being analyzed?  

Step 2: Building the data set

Step 3: Quality control

Step 4: Presentation of insight

Step 5: Lessons learned.

While the data is unique to this community, analyzing and gaining insight from data applies to both the public and private sectors, large and small. Our BI helpdesk is a great place to start if you want to move beyond text and gain insight from your data. If you have a larger project involving data transformation and unlocking the full power of your data, connect here... we would love to start a conversation.

Step 1: Understanding the data

"Statistics. The science that says if I ate a whole chicken and you didn't eat any, then each of us ate half a chicken." Dino “Pitigrilli” Segrè

When we first started analyzing the summary data, a couple of elements caused me to wonder how the information was grouped: traffic stops were down from 5 years prior but not dramatically and not drawn attention to in the narrative, arrests were up - cited and released were down - together there was not a major difference, there was a 3 to 1 ratio of charges to arrests, but most significantly was the inclusion of 2020 the year of COVID in the averages.  

2020 was an anomaly in data points. How to treat an anomaly is important because it can impact statistical calculations such as "average". There are some accepted practices, remove it from consideration, run the calculation both ways and show the difference to let the audience decide or include a footnote at a minimum.  

That first pass did not match the narrative, which resulted in a further investigation. The source for the published information was the police RMS (records management system). This source has significant PII (personal identifying information), and the effort to redact sensitive information can be high and time-consuming. The other source was the dispatch system, which would have less information but had many of the elements needed for initial analysis.

We requested two years of dispatch data: 2022 and 2023. This was a balance of having enough data to analyze and compare without the burden of gathering the data being too high.

From the dispatch system, we now had (plus a few more data points):

  • Incident number
  • Date & Time
  • Cross Street
  • Zip code
  • Activity category
  • Police Department responding

Matching up the information was straightforward:  

  • "Incident number" equaled "Calls for Service." That was clarified as a citizen, or a police officer could generate an incident. There was no way to break this down. While we thought it might be vital as we progressed, that subtlety was not relevant and could be roughly correlated to the activity category.  
  • The activity category was consistent with the RMS.
  • Time stamps allowed correlation with public noticeable incident reports for deeper dives into specific activities.

Having a common data definition was critical in establishing credibility in the analysis. "Calls for service" were first thought to be just citizens calling 911, but when it was learned that officers could also initiate a "call for service," the overall information made more sense.

We now had over 5,000 records to dive into, and immediately, deeper insights began to emerge. To understand those insights, we needed more data.  

Step 2: Building the data set

“Data will talk to you, if you’re willing to listen to it” Jim Bergeson

The data was not ready for an in-depth conversation.  

The best analogy I can think of when getting data ready to tell a story is what I imagine great authors do when profiling their characters. Each has so many attributes and backstories that make them who they are, but they may never appear in the novel.  

To develop our data further, we needed to link where the activity took place and what municipality it was located in. GIS (Geographic Information System) to the rescue. GIS is a large topic, but for our needs, we needed to put a pin in the street map and elaborate on its location.  

We were able to leverage cross-street information and zip code together to do just that. Using an addressing service, we were able to get latitude and longitude coordinates for each incident and then overlay census maps to evaluate what municipality that incident occurred in.

The need for coordinates was foundational, but unlocking the correct additional dataset to get the municipality was where domain knowledge and specialty tooling paid dividends.  

It was time to talk. Our first conversation was plotting all the incidents on a street map by year. The results were eye opening...  

Step 3: Quality control

"The temptation to form premature theories upon insufficient data is the bane of our profession" - Sherlock Holmes

We were getting close, and visualizing the data showed a need for a row-by-row quality review. Multiple pins showed up over 100 miles away from the municipality we were analyzing. We started our focus there and uncovered some zip codes with numbers transposed.  

We still had the original data and just extended the information. Because of this we were able to review and compare outliers easily. Other data elements were self-correcting cross streets where they were listed as brother street a/street b and street b/street a resulted in the same coordinates.  

Quality control processes in data require constant, repetitive assessments. Perfect data, like perfect testing, comes at too high a cost, and the insights gained from perfect data are directionally significant at a much lower cost in both time and effort. Given the data elements and errors in the source data, we had to loop through a review cycle six times. Each time we identified the root causes of the data errors we were able to automate corrections that reduced each subsequent run.  

Our data is not error free, but after review we have great confidence that those errors are not materially significant.  

Step 4: Presentation of Insight

“The greatest value of a picture is when it forces us to notice what we never expected to see.” - John Tukey

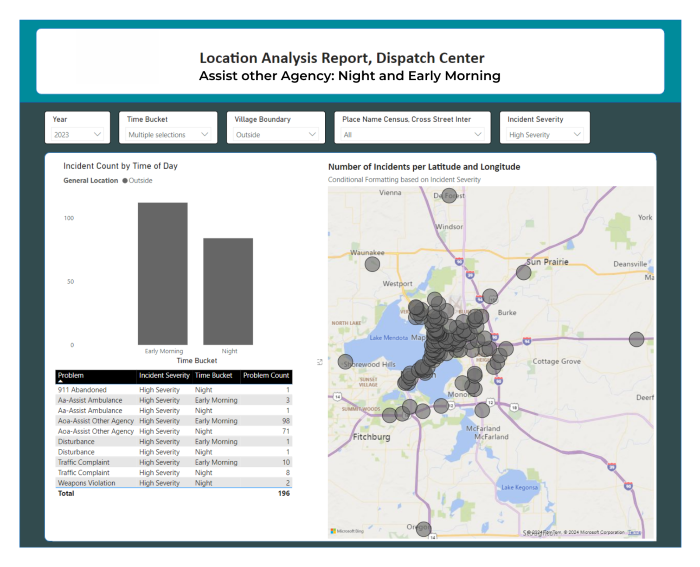
It was not just one story. The data showed multiple stories. Some are related, others highlight policy, and others are coincidental. Digging down, the police were spending a considerable amount of time assisting other agencies as far as 20 miles away. This allowed us to ask better questions and get to the root causes of why. When we presented our map plot it sank in.  

The second was uncovering what caused the major increase in "calls for service".  After reviewing the new analysis, the insight we found is that the single biggest jump year on year was in the "Check Property" category. A pro-active service that the police offered to residents, that had only started to be recorded in the latter part of 2022 and fully in 2023. This activity was considered minimal risk and often performed in 15 minutes or less. This insight along with a communication increase between police agencies explained that calls for service had not jumped by 38% but was 20% and if you factor out the COVID year’s 15%. Add that in 2021 a budget increase added one police officer to the staff, the increase of less than one additional "call for service" per day doesn't seem as grim as the original statement description.  

Step 5: Lessons Learned

Data, turned into information and insight is a powerful tool. It can highlight an unknown root cause, identify patterns of activity, and expose gaps. It should be understandable to all; it can remove fear, uncertainty, and doubt – it can bring people to a common ground.  

“The single biggest threat to the credibility of a presentation is cherry-picked data.” – Edward Tufte

Before presenting – one must understand the why behind the changes in data. The jump in calls for service was not due to a rampant crime spree – after just a little digging the increase in calls reflected a change in late 2022 to how the police department recorded its work. They started to include a proactive service of checking property, changing the definition of the underlying data. This could have been addressed with strong data governance.  

Be sure that you are not building a house of cards. The knock-on assumed correlations were now on shaky ground. Further analysis showed multiple arrests were in other jurisdictions, had multiple arrests per interaction and were focused on one activity “traffic-stops”. Many of these occurred outside the community in question.  

Jumping around units of measure and groupings adds to confusion. Using plain language is also important - “calls for service” sounds like someone dialing 911 and asking for help and does not indicate the police themselves creating these incidents.  The original article quoted 3,163 “calls for service”, that number sounds substantial or broken down you could look at it another way as 8 calls per day or approximately 1 incident every 3 hours.  

The right visual for the right information. Tables are easy, but getting information in a context that people understand and relate to is vital when sharing a story.

Being able to drill into information and answer new questions quickly was great. People could ask and answer their own questions. It became less about how the math was done and more about what the information was saying.  

Policing is a difficult job – there is no doubt about that. Also difficult is balancing budgets, ensuring public trust, and allocating scare resources. An accurate data picture can support municipalities in understanding where resources are allocated and how their workload is broken down. It can also build community trust.  

By: Patrick Grant, Director of Public Sector Sales

Latest

How to Start an Effective Data Governance Program

How to Start an Effective Data Governance Program

Data Governance is about decision-making. Who gets to make the decisions, how they are made, when they are made, etc. There may be several data management tasks or operations that then occur because of the decisions that were made by the data governance program. To have a successful governance program and a data management initiative, these two efforts must be in-sync with each other AND the scope of each should be known and understood. If we understand that data governance is about decision-making, then we can establish that the key to achieving acceptance from the organization for the program is to involve the right people from all parts of the organization in the right places within the program. People want to be heard and involved in decision making. It is also important to note – a data governance program is not a project that ends. It is an ongoing discipline that continues to improve and hopefully thrive over time. The focus of a data governance program could and should change throughout its lifetime as the opportunities around the use of data and information grow within your organization. With the context from above, here are 8 steps to take to implement an effective data governance program within your organization.

Read
Seeing is Believing: Transforming Complex Data into Actionable Insights

Discovery

Seeing is Believing: Transforming Complex Data into Actionable Insights

In today's data-driven world, the ability to extract meaningful insights from vast amounts of information is crucial for making informed decisions and driving business success. However, the sheer volume and complexity of data can often be overwhelming, leaving decision-makers struggling to identify relevant trends and patterns. This is where Pandata Group steps in, offering cutting-edge visualization tools that transform complex data into actionable insights, empowering organizations to navigate their data landscape with confidence.

Read
Simplifying Power BI Data Aggregation: A Comparative Overview

Best Practices

Simplifying Power BI Data Aggregation: A Comparative Overview

In the dynamic world of data science and analytics, professionals must choose the best method for managing and summarizing large datasets. Power BI offers several approaches to tackle this challenge - let's break down some of the techniques to help you understand which might be the best fit for your needs.

Read
Police Data Analysis - Moving from Statistics to Insights

Police Data Analysis - Moving from Statistics to Insights

Read the six-part blog series in one place! Examine how one community dug deeper to analyze policing efforts when the statistics didn't add up. Learn what steps needed to be taken to better understand the data that was presented. From understanding the data and building the data set to quality control and presentation of insight, and finally to the lessons learned.

Read
A Sustainable Future: Initiating Your ESG Journey with Data-Driven Solutions

Discovery

A Sustainable Future: Initiating Your ESG Journey with Data-Driven Solutions

In this week's Looking Forward highlight Guy Nelson explores the importance of embracing sustainability with data-driven initiatives. Assessing your starting point, building a roadmap, leveraging data, and unlocking new insights are just a few of the steps in a journey to sustainability and ESG excellence.

Read
Police Data Analysis - Moving from Statistics to Insights

Police Data Analysis - Moving from Statistics to Insights

This six part blog series examines how one community dug deeper to analyze policing efforts when the statistics didn't add up. We'll showcase what steps needed to be taken to better understand the data that was presented. From understanding the data and building the data set to quality control and presentation of insight, and finally to the lessons learned. Join us each week as we uncover more to the story and move from statistics to insights.

Read
Police Data Analysis - Moving from Statistics to Insights

Data Analytics

Police Data Analysis - Moving from Statistics to Insights

This six part blog series examines how one community dug deeper to analyze policing efforts when the statistics didn't add up. We'll showcase what steps needed to be taken to better understand the data that was presented. From understanding the data and building the data set to quality control and presentation of insight, and finally to the lessons learned. Join us each week as we uncover more to the story and move from statistics to insights.

Read
Why Differentiating Between Data Governance and Data Management Matters

Best Practices

Why Differentiating Between Data Governance and Data Management Matters

This week's Looking Forward blog highlights the importance of differentiating between data governance and data management. Jason Fishbain provides a great reminder of the differences between the two strategies and how each one impacts your organization.

Read
Police Data Analysis - Moving from Statistics to Insights

Data Analytics

Police Data Analysis - Moving from Statistics to Insights

This six part blog series examines how one community dug deeper to analyze policing efforts when the statistics didn't add up. We'll showcase what steps needed to be taken to better understand the data that was presented. From understanding the data and building the data set to quality control and presentation of insight, and finally to the lessons learned. Join us each week as we uncover more to the story and move from statistics to insights.

Read
Unlocking New Possibilities for Business Leaders. Getting Started with Gen AI.

Discovery

Unlocking New Possibilities for Business Leaders. Getting Started with Gen AI.

In the second blog of our Looking Forward series, we explore the discovery category. Here Sumanth Donthula touches on what Generative AI is, how its leveraged, and how you can get started with Gen AI in your organization.

Read
Pandata Group Launches Bamboo SDC:  Rewire Your Sustainability Data Management

Annoucements

Pandata Group Launches Bamboo SDC: Rewire Your Sustainability Data Management

Pandata Group is proud to announce the launch of Bamboo Sustainability Data Cloud (SDC). This innovative platform streamlines the collection and management of Sustainability and Environmental, Social, and Governance (ESG) data, helping organizations enhance efficiency and become more data-driven with accurate, well-modeled, and reliable data. Powered by the Snowflake AI Data Cloud, Bamboo SDC collects, structures, and processes data to develop AI-based insights and sustainability strategies.

Read
Snowflake: Evolving into an AI Powerhouse

Emerging Technologies

Snowflake: Evolving into an AI Powerhouse

What better way to kick off our new blog series, Looking Forward, than to dive into the conversation we're all having - AI. In this blog, Jefferson Duggan explores how Snowflake, a known data warehousing and cloud platform powerhouse, is pivoting to something bigger. He also discusses how emerging technologies such as Open AI are paving the way.

Read
Mastering the Data Cloud Summit: What to Pack

Events

Mastering the Data Cloud Summit: What to Pack

It's that time of the year again. Snowflake Data Cloud Summit is right around the corner and we're planning our trip to San Fransisco. Are you? Over the next few weeks, we'll highlight why you should attend, dos and donts of summit, what to pack, and everything in between to ensure you're prepared for the four-day conference. Explore why you should attend in part one here!

Read
Mastering the Data Cloud Summit: Must Do Activities During Your Visit

Events

Mastering the Data Cloud Summit: Must Do Activities During Your Visit

It's that time of the year again. Snowflake Data Cloud Summit is right around the corner and we're planning our trip to San Fransisco. Are you? Over the next few weeks, we'll highlight why you should attend, dos and donts of summit, what to pack, and everything in between to ensure you're prepared for the four-day conference. Explore why you should attend in part three here!

Read
Mastering the Data Cloud Summit 24: Dos and Donts

Events

Mastering the Data Cloud Summit 24: Dos and Donts

It's that time of the year again. Snowflake Data Cloud Summit is right around the corner and we're planning our trip to San Fransisco. Are you? Over the next few weeks, we'll highlight why you should attend, dos and donts of summit, what to pack, and everything in between to ensure you're prepared for the four-day conference. Explore why you should attend in part one here!

Read
Mastering the Data Cloud Summit 24: Why Attend?

Events

Mastering the Data Cloud Summit 24: Why Attend?

It's that time of the year again. Snowflake Data Cloud Summit is right around the corner and we're planning our trip to San Fransisco. Are you? Over the next few weeks, we'll highlight why you should attend, dos and donts of summit, what to pack, and everything in between to ensure you're prepared for the four-day conference. Explore why you should attend in part one here!

Read
The Secrets of AI Value Creation: Practical Guide to Business Value Creation with Artificial Intelligence from Strategy to Execution

Annoucements

The Secrets of AI Value Creation: Practical Guide to Business Value Creation with Artificial Intelligence from Strategy to Execution

This book presents a comprehensive framework that can be applied to your organization, exploring the value drivers and challenges you might face throughout your AI journey. You will uncover effective strategies and tactics utilized by successful artificial intelligence (AI) achievers to propel business growth.

Read
Using Snowflake Git + Kestra to Automate Pipelines

Best Practices

Using Snowflake Git + Kestra to Automate Pipelines

The power of using Kestra, an open-source declarative data orchestration tool.

Read
Transforming Data into Decisions: The Snowflake Revolution in AI/ML

Digital Transformation

Transforming Data into Decisions: The Snowflake Revolution in AI/ML

In the words of a widely acknowledged metaphor, 'Data is the oil of the 21st century, and AI/ML serves as the combustion engine, powering the machinery of tomorrow's innovations.' This analogy succinctly encapsulates the essence of our digital era, underscoring the indispensable roles that data and artificial intelligence/machine learning technologies play in powering the innovations that shape our future.

Read
Tis the Season of Gratitude: Simple Ways to Show Employees You Care Pt 2

Culture

Tis the Season of Gratitude: Simple Ways to Show Employees You Care Pt 2

Show your team how much you value them and there’s nothing they won’t strive to accomplish. We’ve got 4 great ways to show your employees your appreciation.

Read
Tis the season of gratitude: Simple Ways to Show Employees You Care Pt 1

Culture

Tis the season of gratitude: Simple Ways to Show Employees You Care Pt 1

Employees who feel valued and appreciated by their leaders are far more likely to go above and beyond in their work. Here are 5 simple ways to show gratitude to your team.

Read
Hey, you! Get on to my Cloud!

Industry Clouds

Hey, you! Get on to my Cloud!

The emergence of industry data clouds is to help accelerate the development and adoption of digital solutions such as data, apps, and AI. So, what is a data cloud and how do respective industry’s adopt it? In this series we’ll highlight how a data cloud works, the core benefits, industry use case examples, and potential obstacles to consider when implementing it.

Read
4 Reasons to Work with a Snowflake partner for Data, Analytics, and Machine Learning

Digital Transformation

4 Reasons to Work with a Snowflake partner for Data, Analytics, and Machine Learning

It requires the right technical skillset to realize your data’s full potential and see the benefits of a modern data stack built in the Snowflake Data Cloud.

Read
Why Manufacturing Leaders Should Embrace the Cloud in 2023

Digital Transformation

Why Manufacturing Leaders Should Embrace the Cloud in 2023

Now more than ever, CIOs and Leadership need to collaborate and look to the unique advantages of cloud, data, and analytics

Read
The Whats, Whys, and Hows of an Analytical Community of Excellence

Data Analytics

The Whats, Whys, and Hows of an Analytical Community of Excellence

Communities of Excellence can create operational efficiencies, drive higher ROIs on data related projects, and create trust in the organization’s information.

Read
Snowflake Summit 2023: Three Days In The Desert With Plenty Of Snow

Snowflake Summit 2023: Three Days In The Desert With Plenty Of Snow

From inspiring keynote speeches to hands-on workshops, the Snowflake Summit 2023 provided attendees with invaluable insights and practical knowledge.

Read
Data Modeling In The Cloud Era

Data Modeling In The Cloud Era

Here is why data modeling is a vital part of enterprise data management.

Read
The Time is Now for Manufacturing to Adopt Cloud Analytics

Data Analytics

The Time is Now for Manufacturing to Adopt Cloud Analytics

The manufacturing industry is undergoing a digital transformation, and one of the key technologies driving this transformation is cloud analytics.

Read